Posts Tagged ‘Big Data’

Deciding on Hadoop

July 21, 2016

If you’re considering Hadoop but unsure of which distribution or framework or SQL-on-Hadoop tool to use, Integra can help


Hadoop is an innovative breakthrough in database technology. Your decision to use it can be justified by any number of measures – price, performance, time-to-value, flexibility, functionality, etc. The decision to use Hadoop, however, is but the first of a great many decisions that must be made.

The Open Source community, which gave us Hadoop and the ever-expanding list of projects in its ecosystem, is great at developing new tools and technologies, but not very good at coalescing around its leaders. That makes it harder for potential buyers who must pick the winners and losers themselves and decide upon company standards where no industry standards exist.

That puts the burden of research and decision-making in your hands, starting with whose distribution to use. The leading vendors are Cloudera, Hortonworks, IBM, and MapR Technologies. In my opinion, we have an exception here to the old IT adage: “No one ever got fired for buying IBM.”

Next, you’ve got to choose the best processing framework to use for a particular use case. That was easy in the Hadoop 1.x days, when MapReduce was the only option. These days, the most prominent and, in most cases, the most appropriate framework is Spark. An exception would be search applications, where Solr is better suited.

When it comes to picking a SQL-on-Hadoop tool, there are far too many options to choose from. Your short list should include:

  • Hive
  • Impala
  • Spark SQL
  • Drill

That list could be lengthened with any or all of:

  • Presto
  • BigSQL
  • Phoenix
  • HAWQ

If you’re in a highly concurrent environment where many users are running the same queries at the same time, then Impala is probably best. If you’re in a high reuse environment where the same queries are rerun frequently throughout the day, then Spark SQL is probably best.

Integra can help with these decisions and the myriad of others that come up when selecting and implementing Hadoop and its related ecosystem. We can show you the relative performance of one distribution or technology versus another running your queries against your data. We’ve done this for other customers to help with their selections and implementations. We’ve also given conference presentations and published papers on these issues. Let us share our knowledge and experience with you.

The Problem with NoSQL Databases

June 21, 2016

The title of this post notwithstanding, I’m a huge proponent of the NoSQL movement. It’s evident to me – and many others – that Hadoop and its related projects have given the database industry a wave of innovation unlike anything we’ve seen since Relational Database Management Systems (RDBMS) emerged in the late 1970s and early 1980s. I expect RDBMS will continue to dominate the world of transactional systems, where the relational model / Third Normal Form schemas are perfectly suited for the nature of transaction processing. Analytical systems, on the other hand, can clearly benefit from Hadoop with its ability to scale endlessly, which accommodates the ever-expanding volume of data to be analyzed, and its schema-on-read paradigm, which accommodates the unstructured nature of sentiment data along with the inevitable changes to what data is collected and how it’s analyzed. So, once again, I’m a huge proponent of the NoSQL movement and believe that it will ultimately dominate the world of analytical systems.

The problem with NoSQL databases, however, is that there is no SQL language to use as a common and standard way of working with them. SQL came hand-in-hand with RDBMS and because of its simple, English-like syntax, it was rather trivial to learn. Granted, there were nuances to how each vendor’s optimizer worked that could dramatically affect the time it took for a SQL statement to return results. But it wasn’t long before every vendor replaced their rule-based optimizer with a cost-based optimizer, which essentially made every SQL developer an expert. Thus, with an understanding of SQL, one had the “keys to the kingdom” and the ability to do just about anything with any one of the RDBMS: Oracle, SQL Server, DB2, MySQL, PostgreSQL, etc.

Unlike RDBMS, NoSQL databases have no standard interface (i.e. No SQL). There are multiple frameworks for accessing data in Hadoop, for example. The most common of these are MapReduce (the original, tried-and-true framework), Spark (the current industry favorite for its ability to harness a cluster’s memory the way Hadoop harnesses its disk and CPU), and Solr (for search applications). Furthermore, within each framework, one can choose any number of languages, such as Java, Python, Scala, or R. Of course, there are also SQL-on-Hadoop tools that let you use SQL to access data in Hadoop, many of which also work against other NoSQL databases. But even here, there are a plethora of options to choose from: Hive (endorsed by Hortonworks), Impala (endorsed by Cloudera), and Drill (endorsed by MapR) are popular SQL-on-Hadoop tools; but there’s also Spark SQL, Presto (endorsed by Teradata), BigSQL (endorsed by IBM), HAWQ (endorsed by Pivotal), and Phoenix.

Choice is a good thing, but too much choice can lead to confusion and to buyers taking a “wait-and-see” approach until the market coalesces around the eventual winners. Lack of choice was an important factor in how quickly and readily companies bought into the RDBMS movement 30 or so years ago. I believe that too much choice is holding companies back from buying into the Hadoop / NoSQL movement. Vendors like Cloudera and Hortonworks, who are most active and most influential in the Open Source Hadoop community, should push for standardization around the frameworks, languages and tools within the Hadoop ecosystem. If standardization cannot be driven through the Apache Software Foundation (ASF), then perhaps it can through the American National Standards Institute (ANSI) or the International Organization for Standardization (ISO), as it was when they “blessed” SQL as a standard in 1986 and 1987, respectively.


Hadoop – Whose to Choose (Part 4)

April 8, 2015

Which Hadoop image

By David Teplow

Background  

Big Data is the new normal in data centers today – the inevitable result of the fact that so much of what we buy and what we do is now digitally recorded, and so many of the products we use are leaving their own “digital footprint” (known as the “Internet of Things / IoT”). The cornerstone technology of the Big Data era is Hadoop, which is now a common and compelling component of the modern data architecture. The question these days is not so much whether to embrace Hadoop but rather which distribution to choose. The three most popular and viable distributions come from Cloudera, Hortonworks and MapR Technologies. Their respective products are CDH (Cloudera Distribution of Apache Hadoop), HDP (Hortonworks Data Platform) and MapR. This series of posts looks at the differences between CDH, HDP and MapR. The first focused on The Companies behind them; the second on their respective Management / Administration Tools; the third tackled the important differences between their primary SQL-on-Hadoop Offerings. This fourth and final post will take a look at some recent and relevant Performance Benchmarks.

Performance Benchmarks

In August 2014, the Transaction Processing Performance Council (www.tpc.org) announced the TPC Express Benchmark HS (TPCx-HS). According to the TPC, this benchmark was developed “to provide an objective measure of hardware, operating system and commercial Apache Hadoop File System API compatible software distributions, and to provide the industry with verifiable performance, price-performance and availability metrics.” Simply stated, the TPCx-HS benchmark measures the time it takes a Hadoop cluster to load and sort a given dataset.   Datasets can have a Scale Factor (SF) of 1TB, 3TB, 10TB, 30TB, 100TB, 300TB, 1000TB, 3000TB or 10000TB[1]. The workload consists of the following modules:

  • HSGen – generates the data at a particular Scale Factor (based on TeraGen)
  • HSDataCheck – checks the compliance of the dataset and replication
  • HSSort – sorts the data into a total order (based on TeraSort)
  • HSValidate – validates the output is sorted (based on TeraValidate)

The first TPCx-HS result was published by MapR (with Cisco as its hardware partner) in January 2015. Running MapR M5 Edition 4.0.1 on RHEL 6.4 on a 16-node cluster, their results for sort throughput (higher is better) and price-performance (lower is better) were:

  • 5.07 HSph and $121,231.76/HSph @1TB Scale Factor
  • 5.10 HSph and $120,518.63/HSph @3TB Scale Factor
  • 5.77 HSph and $106,524.27/HSph @10TB Scale Factor

Cloudera responded in March 2015 (with Dell as its hardware partner). Running CDH 5.3.0 on Suse SLES 11 SP3 on a 32-node cluster, their results were:

  • 19.15 HSph and $48,426.85/HSph @30TB Scale Factor (without virtualization)
  • 20.76 HSph and $49,110.55/HSph @30TB Scale Factor (with virtualization[2])

As of April 2015, Hortonworks has yet to publish a TPCx-HS result.

A handful of benchmarks have been run on Hadoop to measure analytical workloads, which are more complex than simple sorts. These benchmarks attempt to mimic real-world data warehouse / business intelligence systems and focus on the relative performance of the different SQL-on-Hadoop offerings. Some of these are derived from the TPC’s existing benchmarks for decision support systems, TPC-DS and TPC-H[3], which have been widely embraced by relational database and data appliance vendors for decades. Two such benchmarks are presented below, along with a third that is not based on a TPC benchmark. All three are fairly recent, having been published in 2014.

Benchmark #1

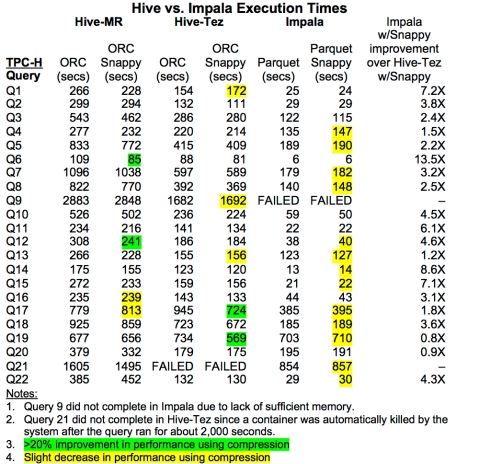
In August 2014, three IBM Researchers published a paper[4] in Proceedings of the VLDB Endowment (Volume 7, No. 12) that compares Impala to Hive. They used the 22 queries specified in the TPC-H Benchmark but left out the refresh streams that INSERT new orders into the ORDERS and LINEITEM tables, then DELETE old orders from them. They ran this workload against a 1TB database / Scale Factor of 1,000[5] (a 3TB database / Scale Factor of 3,000 would have exceeded Impala’s limitation that requires the workload’s working set to fit in the cluster’s aggregate memory).

Results: Compared to Hive on MapReduce:

  • Impala is on average 3.3X faster with compression
  • Impala is on average 3.6X faster without compression

Compared to Hive on Tez:

  • Impala is on average 2.1X faster with compression
  • Impala is on average 2.3X faster without compression

Full Results:

Which Hadoop - table 2

As a side-note to the performance figures above, it’s interesting to see that compression generally helped with Hive and ORC files, at times dramatically (>20%). With Impala and Parquet files, on the other hand, compression hurt performance more often than not and never improved performance significantly (>20%).

Next, they used a subset of the TPC-DS Benchmark, consisting of 20 queries that access a single fact table (STORE_SALES) and 6 dimension tables (the full TPC-DS benchmark involves 99 queries that access 7 fact tables and 17 dimension tables). They ran this workload against a 3TB database / Scale Factor of 3,000[6] and found:

  • Impala is on average 8.2X faster than Hive on MapReduce
  • Impala is on average 4.3X faster than Hive on Tez

Environment: Hive 0.12 on Hadoop 2.0.0 / CDH 4.5.0 for Hive on MapReduce; Hive 0.13 on Tez 0.3.0 and Apache Hadoop 2.3.0 for Hive on Tez; Impala 1.2.2. The cluster consisted of 21 nodes, each with 96GB of RAM connected through a 10Gbit Ethernet switch. Data is stored in Hive using Optimized Row Columnar (ORC) file format and in Impala using Parquet columnar format – both with and without snappy compression.

Benchmark #2

Cloudera published a benchmark[7] in September 2014 shortly after the release of Impala 1.4.0 that compares the performance of Impala versus Hive on Tez versus Spark SQL. It uses a subset of the TPC-DS Benchmark, consisting of 8 “Interactive” queries, 6 “Reporting” queries, and 5 “Analytics” queries, for a total of 19 queries that access a single fact table (STORE_SALES) and 9 dimension tables. They ran this workload against a 15TB database / Scale Factor of 15,000, which is not one of the Scale Factors allowed by TPC. They could have used either 10TB / 10,000 SF or 30TB / 30,000 SF, which are two of the seven Scale Factors that are officially recognized by TPC. They also could have run all 99 of the TPC-DS queries or even the first 19 of the 99 queries, for example, but instead picked and chose 19 of the queries for the single-user test, then just 8 of those for the multi-user test. I have to assume Cloudera chose that particular Scale Factor / database size and those particular queries because they yielded the best comparative results for Impala. This is why I’m generally wary of benchmark results that are published by any given product’s vendor unless they comply with the full benchmark specifications and are independently audited.

Results: With a single-user workload that runs the 19 queries:

  • Impala is on average 7.8X faster than Hive on Tez
  • Impala is on average 3.3X faster than Spark SQL

With 10 concurrent users running just the 8 Interactive queries:

  • Impala is on average 18.3X faster than Hive on Tez
  • Impala is on average 10.6X faster than Spark SQL

Environment:   Impala 1.4.0, Hive 0.13 on Tez and Spark SQL 1.1. 21 node cluster, each with 2 processors, 12 cores, 12 disk drives at 932GB each, and 64GB of RAM. Data is stored in Impala using Parquet columnar format, in Hive using Optimized Row Columnar (ORC) file format, and in Spark SQL using Parquet columnar format – all with snappy compression.

Benchmark #3

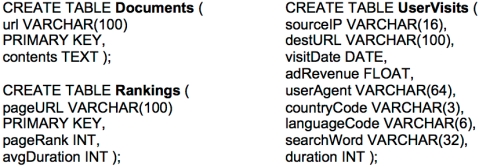
Another Big Data Benchmark[8] was performed by the UC Berkley AMPLab in February 2014. It compares the performance of Impala 1.2.3 versus Hive 0.12 on MapReduce versus Hive 0.12 on Tez 0.2.0 versus Spark SQL 0.8.1 on Amazon EC2 clusters with small, medium and large datasets. Based on the paper “A Comparison of Approaches to Large-Scale Data Analysis” by Pavlo et al. (from Brown University, M.I.T., etc.), it uses the following tables (with data from CommonCrawl.org, which contains petabytes of data collected over 7 years of web crawling):

Which Hadoop - table 3

Against which the following queries are run:

  1. SELECT pageURL, pageRank FROM rankings WHERE pageRank > X;
  2. SELECT SUBSTR(sourceIP, 1, X), SUM(adRevenue) FROM uservisits GROUP BY SUBSTR(sourceIP, 1, X);
  3. SELECT sourceIP, totalRevenue, avgPageRank FROM (SELECT sourceIP, AVG(pageRank) as avgPageRank, SUM(adRevenue) as totalRevenue FROM Rankings AS R, UserVisits AS UV WHERE R.pageURL = UV.destURL AND UV.visitDate BETWEEN Date(`1980-01-01′) AND Date(`X’) GROUP BY UV.sourceIP) ORDER BY totalRevenue DESC LIMIT 1;

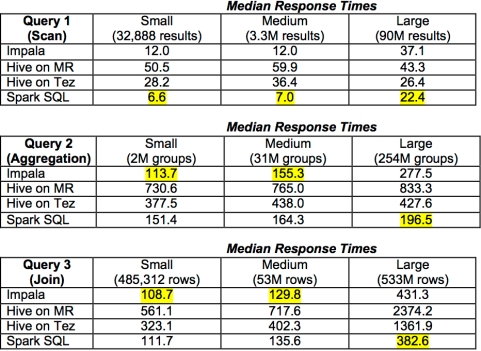
Results:

Which Hadoop - table 4

Conclusion

Impala was clearly built for speed and Cloudera is the current leader in SQL-on-Hadoop performance over Hortonworks with Hive and MapR with Drill. Impala’s lead over Spark SQL, however, is less clear. Spark SQL has the advantage with larger datasets and also with simple range scans regardless of number of rows queried. Hive, while currently slower than Impala, does support a fuller set of SQL commands, including INSERT, UPDATE and DELETE with ACID compliance. It also supports windowing functions and rollup (not yet supported by Impala), UDFs written in any language, and provides fault tolerance. Furthermore, Hive has a brand new Cost-Based Optimizer (Calcite) that, over time, should deliver performance improvements, while also reducing the risk of novice Hive developers dragging down performance with poorly written queries. One advantage Drill holds over Impala, Hive and Spark SQL is its ability to discover a datafile’s schema on the fly without needing the Hive metastore or other metadata.

All three vendors tout the advantages of open source software. After all, Hadoop was essentially born in the open source community (with seminal contributions from Google and Yahoo!) and has thrived in it. Each vendor contributes code and direction to many, if not all, of the open source projects in the Hadoop ecosystem. Hortonworks is by far the most active vendor in this regard, Cloudera next most, and MapR the least active in the open source community. Hortonworks is also the leader in terms of keeping all of its software “in the open”, including its tools for management / administration (Ambari) and SQL-on-Hadoop (Hive). Cloudera and MapR may claim that their management / administration tools are also free but their advanced features are only enabled by paid subscription, or that their SQL-on-Hadoop tools are also open source but virtually all of the code is written by the respective vendor. Furthermore, MapR has made proprietary extensions to one of the core Hadoop projects, HDFS (Hadoop Distributed File System). So in terms of their commitment and contributions to Hadoop and its ecosystem as open source projects, Hortonworks is the leader, followed by Cloudera, followed by MapR.

Ultimately, the choice comes down to your particular priorities and what you’re willing to pay for with your subscription. For example, if MapR’s customizations to HDFS are important to you because they provide better or faster integration with your NAS, then perhaps MapR is right for you. If Hortonworks’ leading involvement in the Apache Hadoop ecosystem is important to you because you believe in the principles of community driven innovation and the promise of better support from the company that contributes more of the code, and in avoiding vendor lock-in due to dependence on their proprietary extensions, then perhaps HDP is right for you. If Cloudera’s Impala is important to you because you need the fastest SQL-on-Hadoop tool – at least for queries that primarily access a single large table and can afford to be restarted if a node fails, then perhaps CDH is right for you.

[1] The corresponding number of records are 10B, 30B, 100B, 300B, 1000B, 3000B, 10000B, 30000B, 100000B, where each record is 100 bytes.

[2] 4 VMs on each of 32 nodes using VMware vSphere 6.0

[3] For detailed specifications, see: http://www.tpc.org/information/current_specifications.asp.

[4] “SQL-on-Hadoop: Full Circle Back to Shared-Nothing Database Architectures” by Avrilia Floratou, Umar Farooq Minhas, Fatma Ozcan – http://www.vldb.org/pvldb/vol7/p1295-floratou.pdf.

[5] 10M rows in the SUPPLIER table; 200M rows in the PART table; 150M rows in the CUSTOMER table; 1.5B rows in the ORDERS table; 6B rows in the LINEITEM table (1-7 Items / Order).

[6] 8.64B rows in the STORE_SALES table; 30M rows in the CUSTOMER table; 360K rows in the ITEM table.

[7] http://blog.cloudera.com/blog/2014/09/new-benchmarks-for-sql-on-hadoop-impala-1-4-widens-the-performance-gap/

[8] https://amplab.cs.berkeley.edu/benchmark/

Hadoop – Whose to Choose (Part 3)

April 1, 2015
Which Hadoop image
By David Teplow

Background

Big Data is the new normal in data centers today – the inevitable result of the fact that so much of what we buy and what we do is now digitally recorded, and so many of the products we use are leaving their own “digital footprint” (known as the “Internet of Things / IoT”). The cornerstone technology of the Big Data era is Hadoop, which is now a common and compelling component of the modern data architecture. The question these days is not so much whether to embrace Hadoop but rather which distribution to choose. The three most popular and viable distributions come from Cloudera, Hortonworks and MapR Technologies. Their respective products are CDH (Cloudera Distribution of Apache Hadoop), HDP (Hortonworks Data Platform) and MapR. This series of posts looks at the differences between CDH, HDP and MapR. The first focused on The Companies behind them; the second on their respective Management / Administration Tools; this third post will tackle the important differences between their primary SQL-on-Hadoop Offerings; and the fourth and final post will take a look at some recent and relevant Performance Benchmarks.

SQL-on-Hadoop Offerings

The SQL language is what virtually every programmer and every tool uses to define, manipulate and query data. This has been true since the advent of relational database management systems (RDBMS) 35 years ago. The ability to use SQL to access data in Hadoop was therefore a critical development. Hive was the first tool to provide SQL access to data in Hadoop through a declarative abstraction layer, the Hive Query Language (QL), and a data dictionary (metadata), the Hive metastore. Hive was originally developed at Facebook and was contributed to the open source community / Apache Software Foundation in 2008 as a subproject of Hadoop. Hive graduated to top-level status in September 2010. Hive was originally designed to use the MapReduce processing framework in the background and, therefore, it is still seen more as a batch-oriented tool than an interactive one.

To address the need for an interactive SQL-on-Hadoop capability, Cloudera developed Impala. Impala is based on Dremel, a real-time, distributed query and analysis technology developed by Google. It uses the same metadata that Hive uses but provides direct access to data in HDFS or HBase through a specialized distributed query engine. Impala streams query results whenever they’re available rather than all at once upon query completion. While Impala offers significant benefits in terms of interactivity and speed (which will be clearly demonstrated in the next post) it also comes with certain limitations. For example, Impala is not fault-tolerant (queries must be restarted if a node fails) and, therefore, may not be suitable for long-running queries. In addition, Impala requires the working set of a query to fit into the aggregate physical memory of the cluster it’s running on and, therefore, may not be suitable for multi-terabyte datasets. Version 2.0.0 of Impala, which was introduced with CDH 5.2.0, has a “Spill to Disk” option that may avoid this particular limitation. Lastly, User-Defined Functions (UDFs) can only be written in Java or C++.

Consistent with its commitment to develop and support only open source software, Hortonworks has stayed with Hive as its SQL-on-Hadoop offering and has worked to make it orders of magnitude faster with innovations such as Tez. Tez was introduced in Hive 0.13 / HDP 2.1 (April 2014) as part of the “Stinger Initiative”. It provides performance improvements for Hive by assembling many tasks into a single MapReduce job rather than many by using Directed Acyclic Graphs (DAGs). From Hive 0.10 (released in January 2013) to Hive 0.13 (April 2014), performance improved an average of 52X on 50 TPC-DS Queries[1] (the total time to run all 50 queries decreased from 187.2 hours to 9.3 hours). Hive 0.14, which was released in November 2014 and comes with HDP 2.2, has support for INSERT, UPDATE and DELETE statements via ACID[2] transactions. Hive 0.14 also includes the initial version of a Cost-Base Optimizer (CBO), which has been named Calcite (f.k.a. Optiq). As we’ll see in the next post, Hive is still slower than its SQL-on-Hadoop alternatives, in part because it writes intermediate results to disk (unlike Impala, which streams data between stages of a query, or Spark SQL, which holds data in memory).

Like Cloudera with Impala, MapR is building its own interactive SQL-on-Hadoop tool with Drill. Like Impala, Drill is also based on Google’s Dremel. Drill began in August 2012 as an incubator project under the Apache Software Foundation and graduated to top-level status in December 2014. MapR employs 13 of the 16 committers on the project. It uses the same metadata that Hive and Impala use (Hive metastore). What’s unique about Drill is that it doesn’t need metadata as schemas can be discovered on the fly (as opposed to RDBMS schema on write or Hive/Impala schema on read) by taking advantage of self-describing data such as that in XML, JSON, BSON, Avro, or Parquet files.

A fourth option that none of the three companies are touting as their primary SQL-on-Hadoop offering but all have included in their distributions is Spark SQL (f.k.a. “Shark”). Spark is another implementation of the DAG approach (like Tez). A significant innovation that Spark offers is Resilient Distributed Datasets (RDDs), an abstraction that makes it possible to work with distributed data in memory. Spark is a top-level project under the Apache Software Foundation. It was originally developed at the UC Berkeley AMPLab, became an incubator project in June 2013, and graduated to top-level status in February 2014. Spark currently has 32 committers from 12 different organizations (the most active being Databricks with 11 committers, UC Berkley with 7, and Yahoo! with 4). CDH 5.3.2 includes Spark 1.2.0; HDP 2.2.2 includes Spark 1.2.1; and MapR 4.1 includes Spark 1.2.1 (as well as Impala 1.4.1). Furthermore, most major tool vendors have native Spark SQL connectors, including MicroStrategy, Pentaho, QlikView, Tableau, Talend, etc. In addition to HDFS, Spark can run against HBase, MongoDB, Cassandra, JSON, and Text Files. Spark not only provides database access (with Spark SQL), but also has built-in libraries for continuous data processing (with Spark Streaming), machine learning (with MLlib), and graphical analytics (with GraphX). While Spark and Spark SQL are still relatively new to the market, they have been rapidly enhanced and embraced, and have the advantage of vendor neutrality – not being owned or invented by any of the three companies, while being endorsed by all three. In my opinion, this gives Spark SQL the best chance of becoming the predominant – if not the standard – SQL-on-Hadoop tool.

My fourth and final post will compare the relative performance of the different distributions and their SQL-on-Hadoop offerings by looking at some recent and relevant Performance Benchmarks.

[1] 30TB dataset / Scale Factor of 30,000 on a 20-node cluster.

[2] Atomic, Consistent, Isolated and Durable – see: http://en.wikipedia.org/wiki/ACID.

Hadoop – Whose to Choose (Part 1)

March 18, 2015

Which Hadoop image

By David Teplow

Background

Big Data is the new normal in data centers today – the inevitable result of the fact that so much of what we buy and what we do is now digitally recorded, and so many of the products we use are leaving their own “digital footprint” (known as the “Internet of Things / IoT”). The cornerstone technology of the Big Data era is Hadoop, which is now a common and compelling component of the modern data architecture. The question these days is not so much whether to embrace Hadoop but rather which distribution to choose. The three most popular and viable distributions come from Cloudera, Hortonworks and MapR Technologies. Their respective products are CDH (Cloudera Distribution of Apache Hadoop), HDP (Hortonworks Data Platform) and MapR. This series of posts will look at the differences between CDH, HDP and MapR. This first post will focus on The Companies behind them; the second on their respective Management/Administration Tools; the third will tackle the important differences between their primary SQL-on-Hadoop Offerings; and the fourth and final post will take a look at some recent and relevant Performance Benchmarks.

Part 1 – The Three Contenders: Cloudera, Hortonworks and MapR

The table below shows some key facts and figures related to each company.

Which Hadoop - table 1

Of the three companies, only Hortonworks is traded publicly (as of 12/12/14; NASDAQ: HDP). So valuations, revenues and other financial measures are harder to ascertain for Cloudera and MapR.

Cloudera’s valuation is based on a $740M investment by Intel in March 2014 for an 18% stake in the company. Hortonworks valuation is based on it’s stock price of $27 on 12/31/14, which happens to be equivalent to their valuation in July 2014 when HP invested $50M for just under 5% of the company. When Hortonworks went public in December 2014, they raised $110M; on top of $248M they had raised privately before their Initial Public Offering (IPO), which totals the $358M in the table above. That’s one third of what Cloudera has raised but twice what MapR has. I haven’t found any information that would allow me to determine a valuation for MapR, though Google Capital and others made an $80M investment in MapR (for an undisclosed equity stake) in June 2014.

Cloudera announced that for the twelve months ending 1/31/15 “Preliminary unaudited total revenue surpassed $100 million.” Hortonworks’ $46M revenue is for the year ending 12/31/14. I haven’t seen revenue figures for MapR for 2014 or any recent 12-month period, so the figure above is Wikibon’s estimate of 2013 revenue. My best guess is that their 2014 revenue was in the $40M to $45M range. Price/Earnings or P/E is a common financial measure for comparing companies, but since none of the three companies have yet to earn any profits, I’ve used Price/Sales in the table above. For comparison, Oracle typically trades at around 5.1X Sales; RedHat at around 7.8X Sales. So 41X for Cloudera and 24X for Hortonworks, while not quite off the scale, are exceedingly high.

The last two rows in the table above show how many employees each company has on the Project Management Committee and as additional Committers on the Apache Hadoop project. This shows their level of involvement in and commitment to Hadoop being sustained and enhanced by the open source community. From the first four rows of Table 1, it is clear that Cloudera has the lead in terms of being first to market, raising the most money, having the highest valuation, and selling the most software. Hortonworks, on the other hand, is the leading proponent of Hadoop as a vibrant and innovative open source project. This is true not only for the core Hadoop project and its most essential sub-projects like Hadoop Common, Hadoop MapReduce and Hadoop YARN (the Project Lead for each of these is employed by Hortonworks[1]), but also for most related projects like Ambari, Hive, Pig, etc.

My next post will explore the different Management/Administration Tools offered by Cloudera, Hortonworks and MapR.

[1] Facebook employs the Project Lead for Hadoop HDFS.

The Database Emperor Has No Clothes

March 12, 2015

Hadoop’s Inherent Advantages Over RDBMS for DW / BI; Especially in the “Big Data” Era

By David Teplow
[NOTE: This article was originally published in The Data Warehousing Institute’s quarterly BI Journal in March 2013.  It was also one of two articles chosen from 2013 to be republished in TDWI’s annual Best of BI in February 2014.]

Background

Relational database management systems (RDBMS) were specified by IBM’s E.F. Codd in 1970 and first commercialized by Oracle Corporation (then Relational Software, Inc.) in 1979. Since that time, practically every database has been built using an RDBMS—either proprietary (Oracle, SQL Server, DB2, and so on) or open source (MySQL, PostgreSQL). This was entirely appropriate for transactional systems that dealt with structured data and benefitted when that data was normalized.

In the late 1980s, we began building decision support systems (DSS)—also referred to as business intelligence (BI), data warehouse (DW), or analytical systems. We used RDBMS for these, too, because it was the de facto standard and essentially the only choice. To meet the performance requirements of DSS, we denormalized the data to eliminate the need for most table joins, which are costly from a resource and time perspective. We accepted this adaptation (some would say “misuse”) of the relational model because there were no other options—until recently.

Relational databases are even less suitable for handling so-called “Big Data.” Transactional systems were designed for just that—transactions; data about a point in time when a purchase occurred or an event happened. Big Data is largely a result of the electronic record we now have about the activity that precedes and follows a purchase or event. This data includes the path taken to a purchase—either physical (surveillance video, location service, or GPS device) or virtual (server log files or clickstream data). It also includes data on where customers may have veered away from a purchase (product review article or comment, shopping cart removal or abandonment, jumping to a competitor’s site), and it certainly includes data about what customers say or do as a result of purchases or events via tweets, likes, yelps, blogs, reviews, customer service calls, and product returns. All this data dwarfs transactional data in terms of volume, and it usually does not lend itself to the structure of tables and fields.

The Problems with RDBMS for DW / BI

To meet the response-time demands of DSS, we pre-joined and pre-aggregated data into star schemas or snowflake schemas (dimensional models) instead of storing data in third normal form (relational models). This implied that we already knew what questions we would need to answer, so we could create the appropriate dimensions by which to measure facts. In the real world, however, the most useful data warehouses and data marts are built iteratively. Over time, we realize that additional data elements or whole new dimensions are needed or that the wrong definition or formula was used to derive a calculated field value. These iterations entail changes to the target schema along with careful and often significant changes to the extract-transform-load (ETL) process.

The benefit of denormalizing data in a data warehouse is that it largely avoids the need for joining tables, which are usually quite large and require an inordinate amount of machine resources and time to join. The risk associated with denormalization is that it makes the data susceptible to update anomalies if field values change.

For example, suppose the price of a certain item changes on a certain date. In our transactional system, we would simply update the Price field in the Item table or “age out” the prior price by updating the effective date and adding a new row to the table with the new price and effective dates. In our data warehouse, however, the price would most likely be contained within our fact table and replicated for each occurrence of the item.

Anomalies can be introduced by an update statement that misses some occurrences of the old price or catches some it shouldn’t have. Anomalies might also result from an incremental data load that runs over the weekend and selects the new price for every item purchased in the preceding week when, in fact, the price change was effective on Wednesday (which may have been the first of the month) and should not have been applied to earlier purchases.

With any RDBMS, the schema must be defined and created in advance, which means that before we can load our data into the data warehouse or data mart, it must be transformed—the dreaded “T” in ETL. Transformation processes tend to be complex, as they involve some combination of deduplicating, denormalizing, translating, homogenizing, and aggregating data, as well as maintaining metadata (that is, “data about the data” such as definitions, sources, lineage, derivations, and so on). Typically, they also entail the creation of an additional, intermediary database—commonly referred to as a staging area or an operational data store (ODS). This additional database comes with the extra costs of another license and database administrator (DBA). This is also true for any data marts that are built, which is often done for each functional area or department of a company.

Each step in the ETL process involves not only effort, expense, and risk, but also requires time to execute (not to mention the time required to design, code, test, maintain, and document the process). Decision support systems are increasingly being called on to support real-time operations such as call centers, military intelligence, recommendation engines, and personalization of advertisements or offers. When update cycles must execute more frequently and complete more rapidly, a complex, multi-step ETL process simply will not keep up when high volumes of data arriving at high velocity must be captured and consumed.

The Problems with Big Data

Big Data is commonly characterized as having high levels of volume, velocity, and variety. Volume has always been a factor in BI/DW, as discussed earlier. The velocity of Big Data is high because it flows from the so-called “Internet of Things,” which is always on and includes not just social media and mobile devices but also RFID tags, Web logs, sensor networks, on-board computers, and more. To make sense of the steady stream of data that these devices emit requires a DSS that, likewise, is always on. Unfortunately, high availability is not standard with RDBMS, although each brand offers options that provide fault resilience or even fault tolerance. These options are neither inexpensive to license nor easy to understand and implement. To ensure that Oracle is always available requires RAC (Real Application Clusters for server failover) and/or Data Guard (for data replication). RAC will add over 48 percent to the cost of your Oracle license; Data Guard, over 21 percent[1].

Furthermore, to install and configure RAC or Data Guard properly is not simple or intuitive, but instead requires specialized expertise about Oracle as well as your operating system. We were willing to pay this price for transactional systems because our businesses depended on them to operate. When the DSS was considered a “downstream” system, we didn’t necessarily need it to be available all the time. For many businesses today, however, decision support is a mainstream system that is needed 24/7.

Variety is perhaps the biggest “Big Data” challenge and the primary reason it’s poorly suited for RDBMS. The many formats of Big Data can be broadly categorized as structured, semi-structured, or unstructured. Most data about a product return and some data about a customer service call could be considered structured and is readily stored in a relational table. For the most part, however, Big Data is semi-structured (such as server log files or likes on a Facebook page) or completely unstructured (such as surveillance video or product-related articles, reviews, comments, or tweets). These data types do not fit neatly—if at all—into tables made up of fields that are rigidly typed (for example, six-digit integer, floating point number, fixed- or variable-length character string of exactly X or no more than Y characters, and so on) and often come with constraints (for example, range checks or foreign key lookups).

Like high availability, high performance is an option for an RDBMS, and vendors have attempted to address this with features that enable partitioning, caching, and parallelization. To take advantage of these features, we have to license these software options and also purchase high-end (that is, expensive) hardware to run it on—full of disks, controllers, memory, and CPUs. We then have to configure the database and the application to take advantage of components such as data partitions, memory caches and/or parallel loads, parallel joins/selects, and parallel updates.

A New Approach

In December of 2004, Google published a paper on MapReduce, which was a method it devised to store data across hundreds or even thousands of servers, then use the power of each of those servers as worker nodes to “map” its own local data and pass along the results to a master node that would “reduce” the result sets to formulate an answer to the question or problem posed. This allowed a “Google-like” problem (such as which servers across the entire Internet have content related to a particular subject and which of those are visited most often) to be answered in near real time using a divide-and-conquer approach that is both massively parallel and infinitely scalable.

Yahoo! used this MapReduce framework with its distributed file system (which grew to nearly 50,000 servers) to handle Internet searches and the required indexing of millions of websites and billions of associated documents. Doug Cutting, who led these efforts at Yahoo!, contributed this work to the open source community by creating the Apache Hadoop project, which he named for his son’s toy elephant. Hadoop has been used by Google and Yahoo! as well as Facebook to process over 300 petabytes of data. In recent years, Hadoop has been embraced by more and more companies for the analysis of more massive and more diverse data sets.

Data is stored in the Hadoop Distributed File System (HDFS) in its raw form. There is no need to normalize (or denormalize) the data, nor to transform it to fit a fixed schema, as there is with RDBMS. Hadoop requires no data schema—and no index schema. There is no need to create indexes, which often have to be dropped and then recreated after data loads in order to accelerate performance. The common but cumbersome practice of breaking large fact tables into data partitions is also unnecessary in Hadoop because HDFS does that by default. All of your data can be readily stored in Hadoop regardless of its volume (inexpensive, commodity disk drives are the norm), velocity (there is no transformation process to slow things down), or variety (there is no schema to conform to).

As for availability and performance, Hadoop was designed from the beginning to be fault tolerant and massively parallel. Data is always replicated on three separate servers, and if a node is unavailable or merely slow, one of the other nodes takes over processing that data set. Servers that recover or new servers that are added are automatically registered with the system and immediately leveraged for storage and processing. High availability and high performance is “baked in” without the need for any additional work, optional software, or high-end hardware.

Although getting data into Hadoop is remarkably straightforward, getting it out is not as simple as with RDBMS. Data in Hadoop is accessed by MapReduce routines that can be written in Java, Python, or Ruby, for example. This requires significantly more work than writing a SQL query. A scripting language called Pig, which is part of the Apache Hadoop project, can be used to eliminate some of the complexity of a programming language such as Java. However, even Pig is not as easy to learn and use as SQL.

Hive is another tool within the Apache Hadoop project that allows developers to build a metadata layer on top of Hadoop (called “HCatalog”) and then access data using a SQL-like interface (called “HiveQL”). In addition to these open source tools, several commercial products can simplify data access in Hadoop. I expect many more products to come from both the open source and commercial worlds to ease or eliminate the complexity inherent in MapReduce, which is currently the biggest inhibitor to Hadoop adoption. One that bears watching is a tool called “Impala,” which is being developed by Cloudera and allows you to run SQL queries against Hadoop in real time. Unlike Pig and Hive, which must be compiled into MapReduce routines and then run in “batch mode,” Impala runs interactively and directly with the data in Hadoop so that query results begin to return immediately.

Conclusion

Relational database Management Systems (RDBMS) have been around for more than 30 years and have proven to be a far better way to handle data than their predecessors. They are particularly well suited for transactional systems, which quickly and rightfully made them a standard for the type of data processing that was prevalent in the 1980s and 1990s. Decades ago, when BI / DW / Analytical systems became common, we found ways to adapt RDBMS for these systems. However, these adaptations were unnatural in terms of the relational model, and inefficient in terms of the data staging and transformation processes they created. We tolerated this because it achieved acceptable results—for the most part. Besides, what other option did we have?

When companies such as Google, Yahoo!, and Facebook found that relational databases were simply unable to handle the massive volumes of data they have to deal with—and necessity being the mother of invention—a new and better way was developed to put data in context (after all, data in context is information; information in context is knowledge). In this age of Big Data, more companies must now deal with data that not only comes in much higher volumes, but also at much faster velocity and in much greater variety.

Relational databases are no longer the only game in town, and for analytical systems (versus transactional systems), they are no longer the best available option.

About the Author
David Teplow began using Oracle with version 2 in 1981, and has worked as a consultant for Database Technologies (1986-1999) and Integra Technology Consulting (2000-present). He can be reached at: DTeplow@IntegraTC.com
[1] Per Processor License costs from the Oracle Technology Global Price List dated July 19, 2012.